It’s starting to get warmer here in Melbourne. Today was the first day of over 20 degrees Celsius we’ve had in…well how long? It feels like a while. We hit this middle part of the year and we don’t get over 20C for a while. But I’d like to know the last time it got over 20 degrees Celsius. How do we do that? With the bomrang package by Adam Sparks!
First, you’ll need the latest version of bomrang - you should be on version 0.7.0.9000 or greater:
# remotes::install_github("ropensci/bomrang")
suppressPackageStartupMessages(library(bomrang))
packageVersion("bomrang")

#> [1] '0.7.0.9000'
Next, we sweep for stations nearby Melbourne. I know there are packages (like geocoder) that help get the coordinates, but when I just need one coordinate I usually just copy it from google maps.
melb_stations <- sweep_for_stations(latlon = c(-37.800372,
                                                        144.996162))

melb_stations

#>        site dist                          name start  end      lat      lon
#>   1: 086338   86      MELBOURNE (OLYMPIC PARK)  2013 2020 -37.8255 144.9816
#>   2: 086220   86       ST KILDA HARBOUR - RMYS  2006 2020 -37.8642 144.9639
#>   3: 086351   86 BUNDOORA (LATROBE UNIVERSITY)  1979 2020 -37.7163 145.0453
#>   4: 086068   86                      VIEWBANK  1999 2020 -37.7408 145.0972
#>   5: 086038   86              ESSENDON AIRPORT  1929 2020 -37.7276 144.9066
#>  ---
#> 883: 300039  300                            G3  1999 2020 -70.8919  69.8725
#> 884: 200284  200          COCOS ISLAND AIRPORT  1901 2020 -12.1892  96.8344
#> 885: 300028  300       HEARD ISLAND (THE SPIT)  1992 2020 -53.1082  73.7225
#> 886: 300005  300     HEARD ISLAND (ATLAS COVE)  1948 2020 -53.0190  73.3918
#> 887: 300001  300                        MAWSON  1954 2020 -67.6017  62.8753
#>      state elev bar_ht   wmo state_code
#>   1:   VIC  7.5    7.5 95936          V
#>   2:   VIC  6.4     NA 95864          V
#>   3:   VIC 83.0     NA 95873          V
#>   4:   VIC 66.1   66.4 95874          V
#>   5:   VIC 78.4   78.8 95866          V
#>  ---
#> 883:   ANT 84.0   84.0 89767          T
#> 884:    WA  3.0    4.0 96996          W
#> 885:   ANT 12.0   12.5 94997          T
#> 886:   ANT  3.0    3.5 95997          T
#> 887:   ANT  9.9   16.0 89564          T
#>                                                         url    distance
#>   1: http://www.bom.gov.au/fwo/IDV60801/IDV60801.95936.json    3.073013
#>   2: http://www.bom.gov.au/fwo/IDV60801/IDV60801.95864.json    7.642001
#>   3: http://www.bom.gov.au/fwo/IDV60801/IDV60801.95873.json   10.298180
#>   4: http://www.bom.gov.au/fwo/IDV60801/IDV60801.95874.json   11.079185
#>   5: http://www.bom.gov.au/fwo/IDV60801/IDV60801.95866.json   11.289837
#>  ---
#> 883: http://www.bom.gov.au/fwo/IDT60803/IDT60803.89767.json 5536.751202
#> 884: http://www.bom.gov.au/fwo/IDW60801/IDW60801.96996.json 5544.800897
#> 885: http://www.bom.gov.au/fwo/IDT60803/IDT60803.94997.json 5562.364714
#> 886: http://www.bom.gov.au/fwo/IDT60803/IDT60803.95997.json 5586.092643
#> 887: http://www.bom.gov.au/fwo/IDT60803/IDT60803.89564.json 5844.280345
This then returns information on the number of stations in Melbourne and their location.
We take the first station and get the max temperature.
melbourne_weather <- get_historical(stationid = melb_stations$site[1],
                                    type = "max")

#> Warning: The list of available stations for `type = rain` is currently empty.
#> This is likely a temporary error in the Bureau of Meteorology's
#> database and may cause requests for rain station data to fail.

#> Data saved as /var/folders/mw/gj7418356js6s29x7wn8crfmljy4wh/T//RtmpfgXQLS/IDCJAC0010_086338_1800_Data.csv


melbourne_weather

#>   --- Australian Bureau of Meteorology (BOM) Data Resource ---
#>   (Original Request Parameters)
#>   Station:    MELBOURNE (OLYMPIC PARK) [086338]
#>   Location:    lat: -37.8255, lon: 144.9816
#>   Measurement / Origin:  Max / Historical
#>   Timespan:    2013-06-01 -- 2020-09-01 [7.3 years]
#>   ---------------------------------------------------------------
#>       product_code station_number year month day max_temperature accum_days_max
#>    1:   IDCJAC0010          86338 2013     1   1              NA             NA
#>    2:   IDCJAC0010          86338 2013     1   2              NA             NA
#>    3:   IDCJAC0010          86338 2013     1   3              NA             NA
#>    4:   IDCJAC0010          86338 2013     1   4              NA             NA
#>    5:   IDCJAC0010          86338 2013     1   5              NA             NA
#>   ---
#> 2812:   IDCJAC0010          86338 2020     9  12            16.0              1
#> 2813:   IDCJAC0010          86338 2020     9  13            17.2              1
#> 2814:   IDCJAC0010          86338 2020     9  14            16.6              1
#> 2815:   IDCJAC0010          86338 2020     9  15            15.8              1
#> 2816:   IDCJAC0010          86338 2020     9  16            22.8              1
#>       quality
#>    1:
#>    2:
#>    3:
#>    4:
#>    5:
#>   ---
#> 2812:       N
#> 2813:       N
#> 2814:       N
#> 2815:       N
#> 2816:       N
We can convert this into a date format with one of my favourite R functions of all time, ISOdate() (also ISOdatetime() is great):
melb_weather_date <- melbourne_weather %>%
  mutate(date = ISOdate(year, month, day))

melb_weather_date

#>   --- Australian Bureau of Meteorology (BOM) Data Resource ---
#>   (Original Request Parameters)
#>   Station:    MELBOURNE (OLYMPIC PARK) [086338]
#>   Location:    lat: -37.8255, lon: 144.9816
#>   Measurement / Origin:  Max / Historical
#>   Timespan:    2013-06-01 -- 2020-09-01 [7.3 years]
#>   ---------------------------------------------------------------
#>       product_code station_number year month day max_temperature accum_days_max
#>    1:   IDCJAC0010          86338 2013     1   1              NA             NA
#>    2:   IDCJAC0010          86338 2013     1   2              NA             NA
#>    3:   IDCJAC0010          86338 2013     1   3              NA             NA
#>    4:   IDCJAC0010          86338 2013     1   4              NA             NA
#>    5:   IDCJAC0010          86338 2013     1   5              NA             NA
#>   ---
#> 2812:   IDCJAC0010          86338 2020     9  12            16.0              1
#> 2813:   IDCJAC0010          86338 2020     9  13            17.2              1
#> 2814:   IDCJAC0010          86338 2020     9  14            16.6              1
#> 2815:   IDCJAC0010          86338 2020     9  15            15.8              1
#> 2816:   IDCJAC0010          86338 2020     9  16            22.8              1
#>       quality                date
#>    1:         2013-01-01 12:00:00
#>    2:         2013-01-02 12:00:00
#>    3:         2013-01-03 12:00:00
#>    4:         2013-01-04 12:00:00
#>    5:         2013-01-05 12:00:00
#>   ---
#> 2812:       N 2020-09-12 12:00:00
#> 2813:       N 2020-09-13 12:00:00
#> 2814:       N 2020-09-14 12:00:00
#> 2815:       N 2020-09-15 12:00:00
#> 2816:       N 2020-09-16 12:00:00
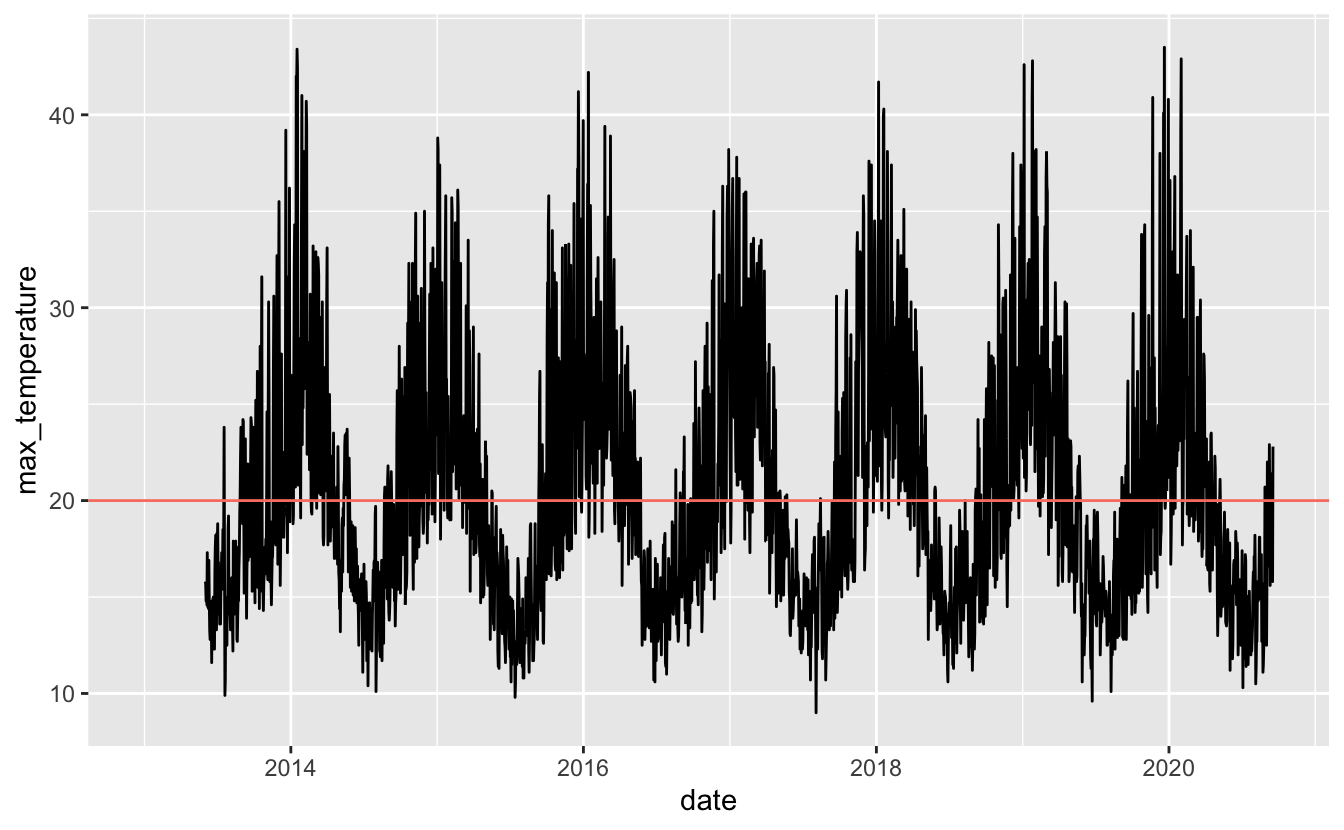
Now we can look at when it last hit 20C for the past little while:
suppressPackageStartupMessages(library(ggplot2))

ggplot(melb_weather_date,
       aes(x = date,
           y = max_temperature)) +
  geom_line() +
  geom_hline(yintercept = 20, colour = "salmon")

#> Warning: Removed 151 row(s) containing missing values (geom_path).
Let’s just focus on 2020:
suppressPackageStartupMessages(library(dplyr))
melb_weather_2020 <- melb_weather_date %>%
  filter(year == 2020)

melb_2020_plot <-
ggplot(melb_weather_2020,
       aes(x = date,
           y = max_temperature)) +
  geom_line() +
  geom_hline(yintercept = 20, colour = "salmon")

melb_2020_plot

So now rather than squinting at a graph, I want to return the last times it was over 20C.
I was tempted to try something like this:
melb_weather_2020 %>%
  filter(max_temperature > 20) %>%
  ggplot(aes(x = date,
           y = max_temperature)) +
  geom_line() +
  geom_hline(yintercept = 20, colour = "salmon")
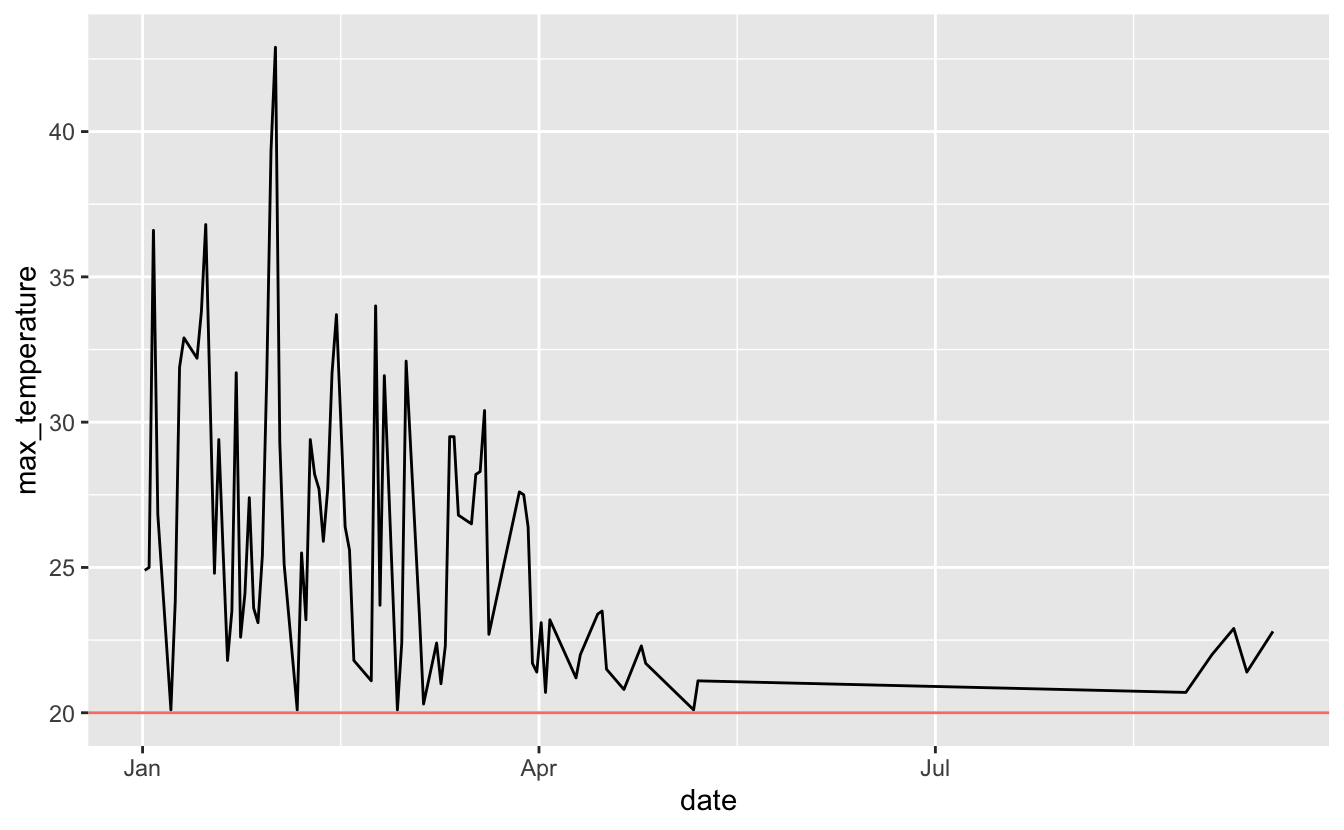
But this doesn’t realllly help me. We just see a bit gap. I still need to squint. Let’s take a look at the plot again:
melb_2020_plot
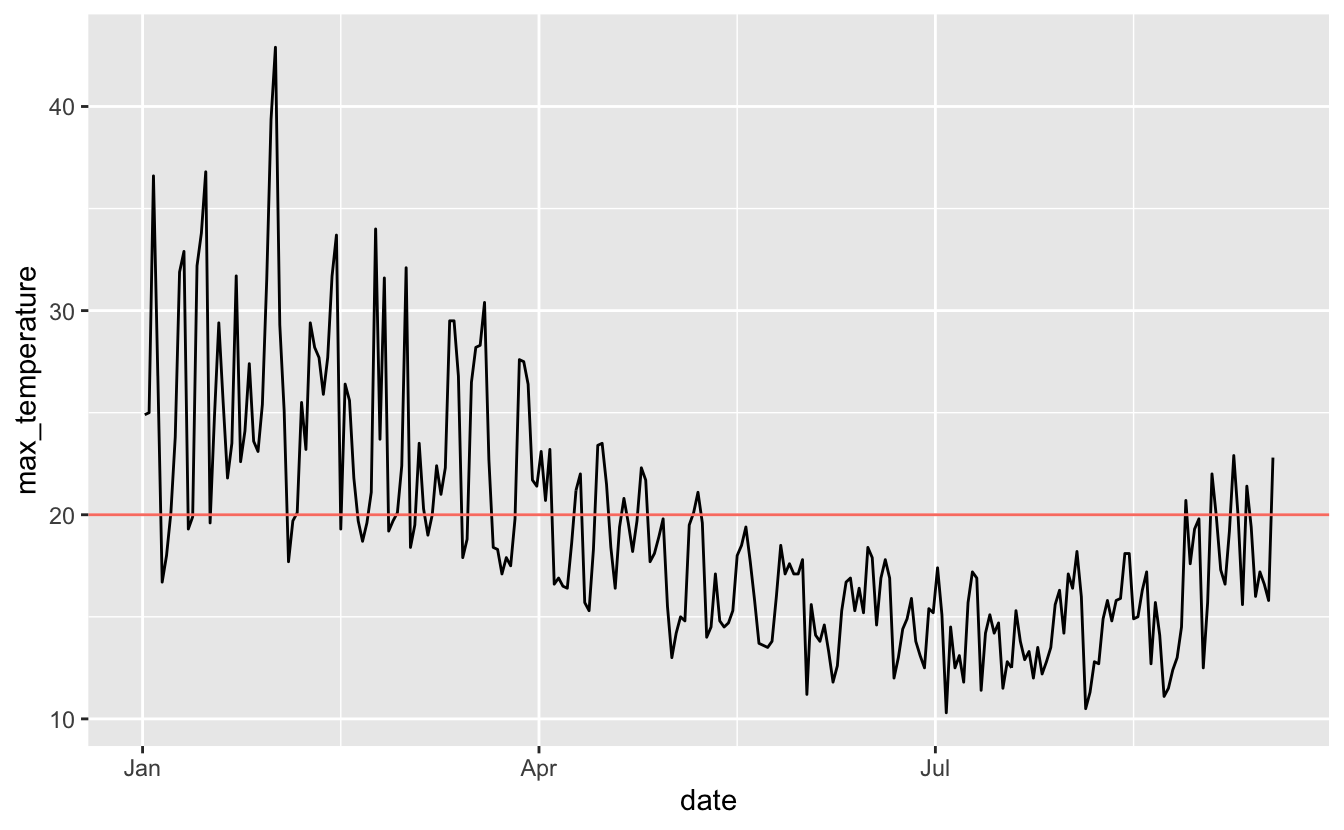
I want to be able to identify when it stopped being over 20, and then when it started again.
Buckle up, we’re going into the realm of RLE - Run Length Encodings.
Earo Wang first showed this to me I first arrived at Monash, (where it was used for miss_var_run).
rle counts the length of a “run” of a vector. Here’s an example to explain from the help file:
z <- c(TRUE, TRUE, FALSE, FALSE, TRUE, FALSE, TRUE, TRUE, TRUE)
rle(z)

#> Run Length Encoding
#>   lengths: int [1:5] 2 2 1 1 3
#>   values : logi [1:5] TRUE FALSE TRUE FALSE TRUE
So this tells us that we have 2 runs of the same thing, then 2 more, then 1, 1, and 3. Another way I think about it is is like a simplified/summary of storing a number. Here’s another brief example to help get this solidified:
rle(1:10)

#> Run Length Encoding
#>   lengths: int [1:10] 1 1 1 1 1 1 1 1 1 1
#>   values : int [1:10] 1 2 3 4 5 6 7 8 9 10

rle(c(1,2,2,3,3,3))

#> Run Length Encoding
#>   lengths: int [1:3] 1 2 3
#>   values : num [1:3] 1 2 3

rle(c(1,1,1,2,2,3))

#> Run Length Encoding
#>   lengths: int [1:3] 3 2 1
#>   values : num [1:3] 1 2 3
So, we can use rle to calculate the run of the times that temperature was below 20. We can calculate a new column that is TRUE when temperature is below, and FALSE otherwise:
melb_weather_2020 %>%
  mutate(below_20 = max_temperature < 20)

#>   --- Australian Bureau of Meteorology (BOM) Data Resource ---
#>   (Original Request Parameters)
#>   Station:    MELBOURNE (OLYMPIC PARK) [086338]
#>   Location:    lat: -37.8255, lon: 144.9816
#>   Measurement / Origin:  Max / Historical
#>   Timespan:    2013-06-01 -- 2020-09-01 [7.3 years]
#>   ---------------------------------------------------------------
#>      product_code station_number year month day max_temperature accum_days_max
#>   1:   IDCJAC0010          86338 2020     1   1            24.9              1
#>   2:   IDCJAC0010          86338 2020     1   2            25.0              1
#>   3:   IDCJAC0010          86338 2020     1   3            36.6              1
#>   4:   IDCJAC0010          86338 2020     1   4            26.8              1
#>   5:   IDCJAC0010          86338 2020     1   5            16.7              1
#>  ---
#> 256:   IDCJAC0010          86338 2020     9  12            16.0              1
#> 257:   IDCJAC0010          86338 2020     9  13            17.2              1
#> 258:   IDCJAC0010          86338 2020     9  14            16.6              1
#> 259:   IDCJAC0010          86338 2020     9  15            15.8              1
#> 260:   IDCJAC0010          86338 2020     9  16            22.8              1
#>      quality                date below_20
#>   1:       Y 2020-01-01 12:00:00    FALSE
#>   2:       Y 2020-01-02 12:00:00    FALSE
#>   3:       Y 2020-01-03 12:00:00    FALSE
#>   4:       Y 2020-01-04 12:00:00    FALSE
#>   5:       Y 2020-01-05 12:00:00     TRUE
#>  ---
#> 256:       N 2020-09-12 12:00:00     TRUE
#> 257:       N 2020-09-13 12:00:00     TRUE
#> 258:       N 2020-09-14 12:00:00     TRUE
#> 259:       N 2020-09-15 12:00:00     TRUE
#> 260:       N 2020-09-16 12:00:00    FALSE
then pull it out
melb_weather_2020 %>%
  mutate(below_20 = max_temperature < 20) %>%
  pull(below_20)

#>   [1] FALSE FALSE FALSE FALSE  TRUE  TRUE FALSE FALSE FALSE FALSE  TRUE  TRUE
#>  [13] FALSE FALSE FALSE  TRUE FALSE FALSE FALSE FALSE FALSE FALSE FALSE FALSE
#>  [25] FALSE FALSE FALSE FALSE FALSE FALSE FALSE FALSE FALSE  TRUE  TRUE FALSE
#>  [37] FALSE FALSE FALSE FALSE FALSE FALSE FALSE FALSE FALSE  TRUE FALSE FALSE
#>  [49] FALSE  TRUE  TRUE  TRUE FALSE FALSE FALSE FALSE  TRUE  TRUE FALSE FALSE
#>  [61] FALSE  TRUE  TRUE FALSE FALSE  TRUE FALSE FALSE FALSE FALSE FALSE FALSE
#>  [73] FALSE  TRUE  TRUE FALSE FALSE FALSE FALSE FALSE  TRUE  TRUE  TRUE  TRUE
#>  [85]  TRUE  TRUE FALSE FALSE FALSE FALSE FALSE FALSE FALSE FALSE  TRUE  TRUE
#>  [97]  TRUE  TRUE  TRUE FALSE FALSE  TRUE  TRUE  TRUE FALSE FALSE FALSE  TRUE
#> [109]  TRUE  TRUE FALSE  TRUE  TRUE  TRUE FALSE FALSE  TRUE  TRUE  TRUE  TRUE
#> [121]  TRUE  TRUE  TRUE  TRUE  TRUE  TRUE FALSE FALSE  TRUE  TRUE  TRUE  TRUE
#> [133]  TRUE  TRUE  TRUE  TRUE  TRUE  TRUE  TRUE  TRUE  TRUE  TRUE  TRUE  TRUE
#> [145]  TRUE  TRUE  TRUE  TRUE  TRUE  TRUE  TRUE  TRUE  TRUE  TRUE  TRUE  TRUE
#> [157]  TRUE  TRUE  TRUE  TRUE  TRUE  TRUE  TRUE  TRUE  TRUE  TRUE  TRUE  TRUE
#> [169]  TRUE  TRUE  TRUE  TRUE  TRUE  TRUE  TRUE  TRUE  TRUE  TRUE  TRUE  TRUE
#> [181]  TRUE  TRUE  TRUE  TRUE  TRUE  TRUE  TRUE  TRUE  TRUE  TRUE  TRUE  TRUE
#> [193]  TRUE  TRUE  TRUE  TRUE  TRUE  TRUE  TRUE  TRUE  TRUE  TRUE  TRUE  TRUE
#> [205]  TRUE  TRUE  TRUE  TRUE  TRUE  TRUE  TRUE  TRUE  TRUE  TRUE  TRUE  TRUE
#> [217]  TRUE  TRUE  TRUE  TRUE  TRUE  TRUE  TRUE  TRUE  TRUE  TRUE  TRUE  TRUE
#> [229]  TRUE  TRUE  TRUE  TRUE  TRUE  TRUE  TRUE  TRUE  TRUE  TRUE  TRUE FALSE
#> [241]  TRUE  TRUE  TRUE  TRUE  TRUE FALSE  TRUE  TRUE  TRUE  TRUE FALSE  TRUE
#> [253]  TRUE FALSE  TRUE  TRUE  TRUE  TRUE  TRUE FALSE
And then use rle on the vector of TRUE/FALSE
melb_rle <- melb_weather_2020 %>%
  mutate(below_20 = max_temperature < 20) %>%
  pull(below_20) %>%
  rle()

melb_rle

#> Run Length Encoding
#>   lengths: int [1:43] 4 2 4 2 3 1 17 2 10 1 ...
#>   values : logi [1:43] FALSE TRUE FALSE TRUE FALSE TRUE ...
This provides two named vectors, lengths and values. Lengths is the number of times a corresponding value repeats.
We can then identify what the largest gap was by taking the max of lengths:
# what was the largest gap?
what_gap <- max(melb_rle$lengths)

what_gap

#> [1] 111
Neat! So we now know that the period between the start and the end spanned 111 days.
So, when was that?
This part involves a few steps, let me break it down.
We want to find that date it was last over 20C - which is the day before it had that 111 day stretch. We can get this by summing up all the numbers of run lengths before the 111 day stretch.
First we calculate which position has the max with which.max. I like to print the vector with it for my own sanity’s sake:
which.max(melb_rle$lengths)

#> [1] 34

melb_rle$lengths

#>  [1]   4   2   4   2   3   1  17   2  10   1   3   3   4   2   3   2   2   1   7
#> [20]   2   5   6   8   5   2   3   3   3   1   3   2  10   2 111   1   5   1   4
#> [39]   1   2   1   5   1
So it is the 34th one.
But we want the second last one - the day before 111, so we subtract 1.
last_day_position <- which.max(melb_rle$lengths) - 1
last_day_position

#> [1] 33
We then want 1 through to that number so we can get all the numbers out, using seq_len:
seq_last_day_position <- seq_len(last_day_position)
seq_last_day_position

#>  [1]  1  2  3  4  5  6  7  8  9 10 11 12 13 14 15 16 17 18 19 20 21 22 23 24 25
#> [26] 26 27 28 29 30 31 32 33
We then subset this lengths like so, and sum them up to get the number of days before it went below 20C:
melb_rle$lengths[seq_last_day_position]

#>  [1]  4  2  4  2  3  1 17  2 10  1  3  3  4  2  3  2  2  1  7  2  5  6  8  5  2
#> [26]  3  3  3  1  3  2 10  2

n_days_before_20c <- sum(melb_rle$lengths[seq_last_day_position])
n_days_before_20c

#> [1] 128
Now…what date is that?
We can use lubridate to calculate it like so, by saying, the number of days from the start of 2020:
library(lubridate)

#>
#> Attaching package: 'lubridate'

#> The following objects are masked from 'package:base':
#>
#>     date, intersect, setdiff, union

# when was that?
last_day_of_20c <- ymd("2020-01-01") + days(n_days_before_20c)
last_day_of_20c

#> [1] "2020-05-08"
Awesome, now when did it finish?
# when did it end?
first_day_of_20c <- last_day_of_20c + days(what_gap)
first_day_of_20c

#> [1] "2020-08-27"
And just to come full circle, let’s check the difference
first_day_of_20c - last_day_of_20c

#> Time difference of 111 days
whew! That was a lot of work. I almost forgot what I was trying to answer so let’s put this in a header now
When was the last time in 2020 Melbourne was above 20 Celsius?
- The last day of over 20C was 2020-05-08
- The first day of over 20C was 2020-08-27
- Which means we had 111 days where Melbourne was below 20C.
Post Script
In retrospect there is more to add to this plot, and probably other simpler ways to calculate this, I’m keen to hear your thoughts below.
I suspect this sort of function will come in handy in the future as we start to compare COVID19 days, to help us answer: “when was the last day of … cases”.
I’m trying to get this blog post out in one sitting so I’ll skip over writing a function for this, this time Here is a function and an example below of this, which might be useful:
n_days_below <- function(x, below){
  rle_below <- rle(x < below)
  max(rle_below$lengths)
}

last_day_below <- function(x, below){
  rle_below <- rle(x < below)
  last_day_position <- which.max(rle_below$lengths) - 1
  seq_last_day_position <- seq_len(last_day_position)
  n_days_before_below <- sum(rle_below$lengths[seq_last_day_position])
  n_days_before_below
}

summary_days_below <- function(x, below, origin){

  vec_n_days_below <- n_days_below(x, below)
  vec_last_day_below <- n_days_below(x, below)

  last_day_of_below <- lubridate::ymd(origin) + lubridate::days(vec_last_day_below)
  first_day_of_below <- last_day_of_below + vec_n_days_below

  list(last_date_below = last_day_of_below,
       first_date_above = first_day_of_below,
       time_between = first_day_of_below - last_day_of_below)

}

n_days_below(melb_weather_2020$max_temperature, 20)

#> [1] 111

last_day_below(melb_weather_2020$max_temperature, 20)

#> [1] 128

summary_days_below(melb_weather_2020$max_temperature, 20, "2020-01-01")

#> $last_date_below
#> [1] "2020-04-21"
#>
#> $first_date_above
#> [1] "2020-08-10"
#>
#> $time_between
#> Time difference of 111 days
A side note on the history of bomrang
I take great joy in seeing bomrang and using it. I first posted an issue about it in 2016 at the rOpenSci unconf which was held in the USA, but Miles, Jessie, and I (And also Alex Simmons) participated remotely, with Bob Rudis, Brooke Anderson, Maëlle Salmon and a few folks. My memory is a bit hazy because in order to keep pace with the USA we had to stay up all night, and I don’t really remember the days before or after it. It got somewhere, but I didn’t really know what we were doing, I just thought, “this should be a thing, why can’t I get Australian weather data from R?”, but had no idea what I was doing with web scraping, and knew nothing about the weather other than what I’d seen on the news and that lightning can indeed strike the same place twice. So I suggested the idea, but everyone else provided the know how. It was hard, because it turned out the BoM weather bureau API didn’t exist and required a bit of domain expertise
Next, it was picked up by much more experienced team at the first Australian rOpenSci Ozunconf (then, au-unconf), in 2016 in Brisbane. Happily they knew what they were doing, and has experience with Australian weather data. The project grew from there, being headed by Adam Sparks, initially it was called bomr, but Di Cook suggested, “bomrang”, the name stuck, and Adam submitted it to rOpenSci for package review, and the package became more mature and in it’s current state of glory.