You want to use a nice colour palette but you’re not sure if it’s colour blind friendly? Here are some quick ways to check this in #rstats.
Using prismatic
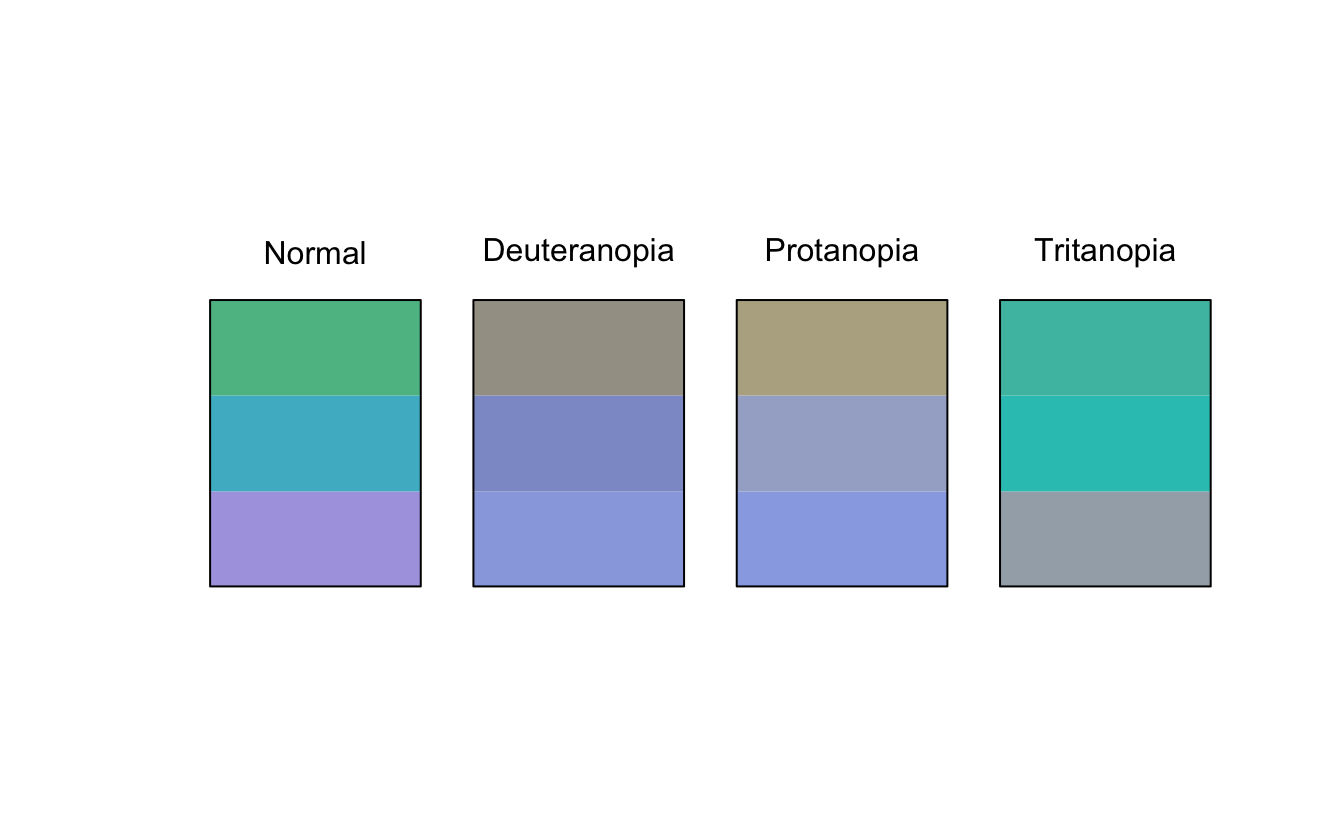
The prismatic package by Emil Hvitfeldt provides some nice approaches to this with the function check_color_blindness(). You provide a vector of colour codes, and it simulates how they appear for people with different types of colourblindness.
For example, we can check the “Cold” palette from the qualitative_chl colour palette from colorspace by Achim Zeileis and co, like so:
library(colorspace)
hcl_cold <-
qualitative_hcl(n = 3,
                palette = "Cold")

library(prismatic)
check_color_blindness(hcl_cold)
But what if you want to check a few palettes in quicker succession? I used a function like this to help. First, getting a handle on what qualitative colour palettes are available:
hcl_pals_q <- hcl_palettes(type = "qualitative")
hcl_pals_q

#> HCL palettes
#>
#> Type:  Qualitative
#> Names: Pastel 1, Dark 2, Dark 3, Set 2, Set 3, Warm, Cold, Harmonic, Dynamic
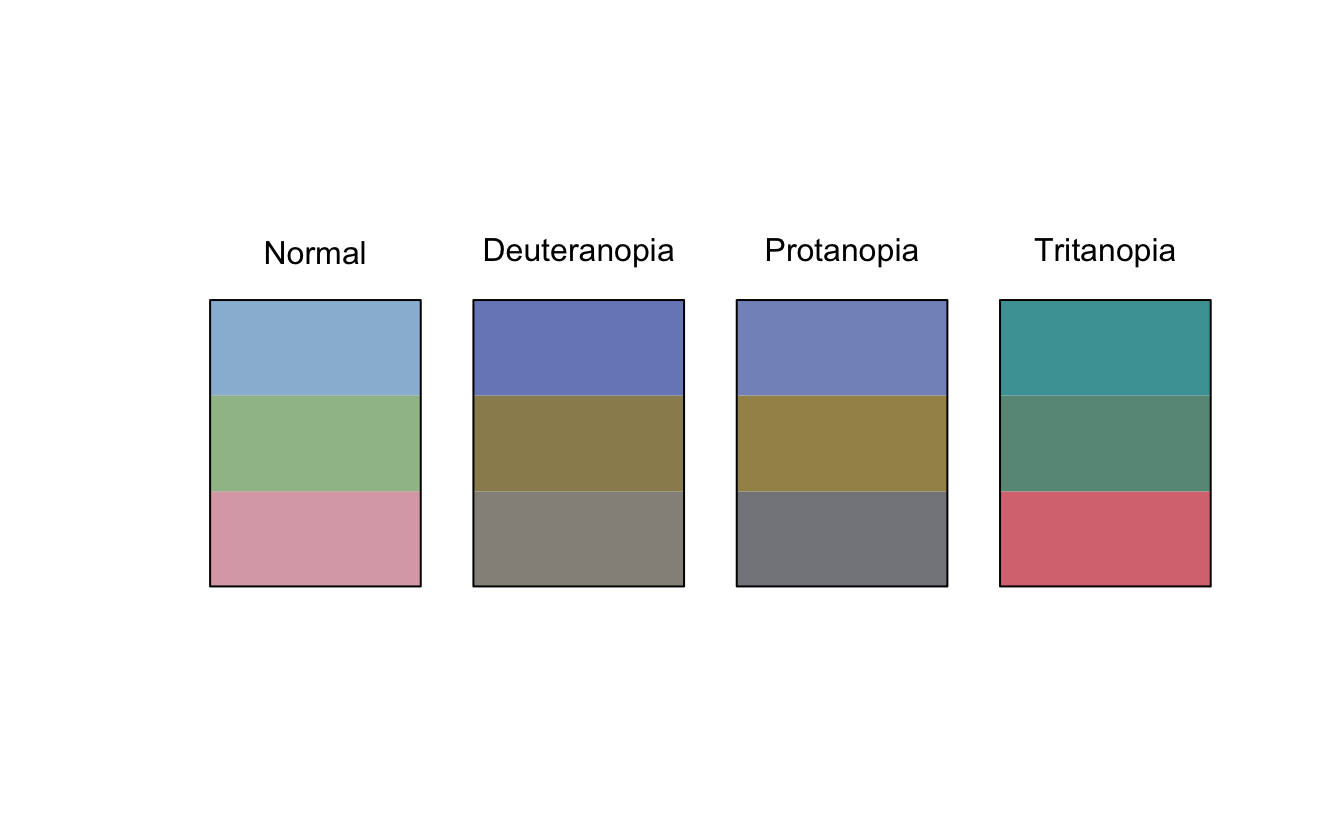
Then writing a function to pick three colours. I also needed a specific alpha level of 0.67, but that was just me. I called it qual_cvd because it assesses qualitative colour palettes for colour vision deficiency (CVD).
library(magrittr)
qual_cvd <- function(palette = "Pastel1", alpha = 0.67){
  qualitative_hcl(n = 3,
                  alpha = alpha,
                  palette = palette)  %>%
    check_color_blindness()
}
Then we can demonstrate it like so:
qual_cvd("Dark 2")
qual_cvd("Dark 3")
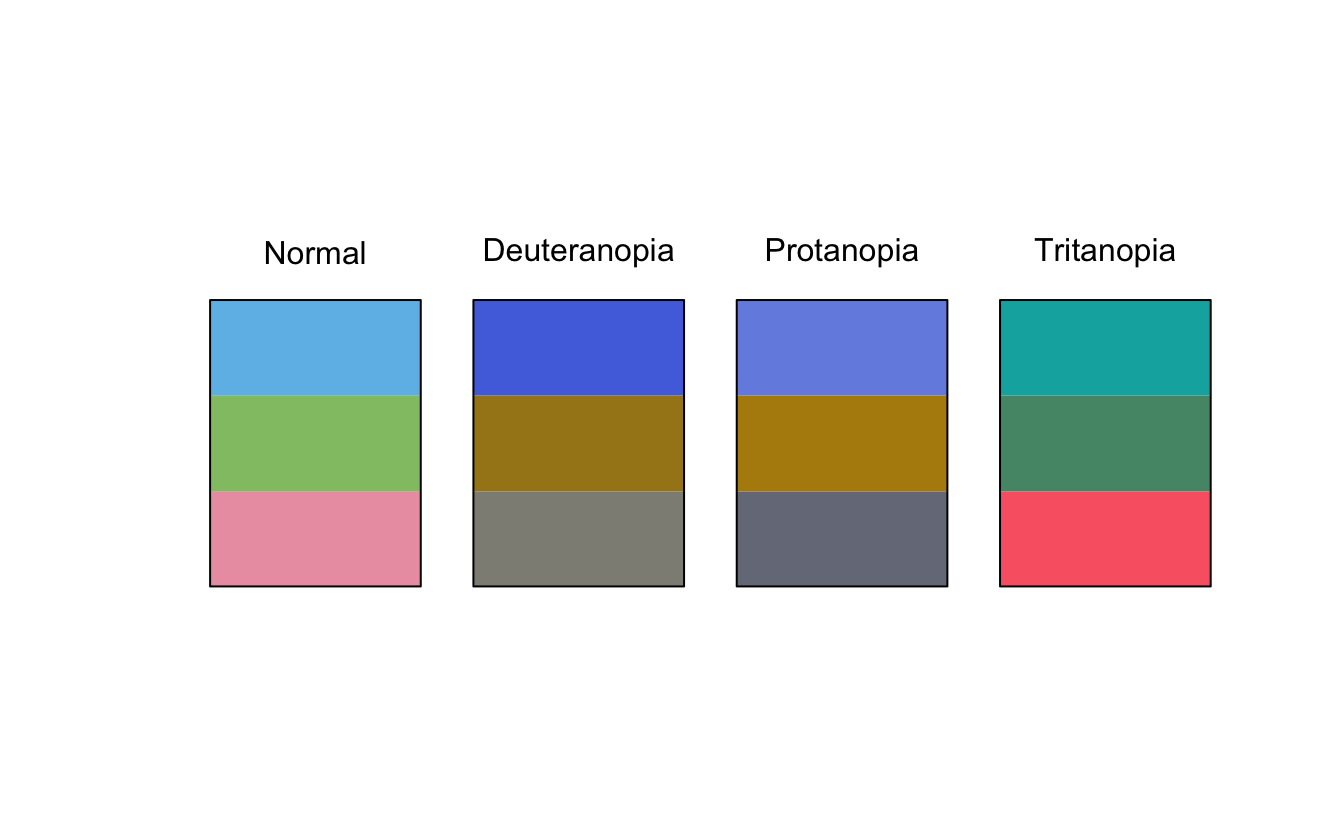
Looks like Dark 3 is a good one!
Using colorspace
The colorspace package provides some really nice functions for exploring CVD.
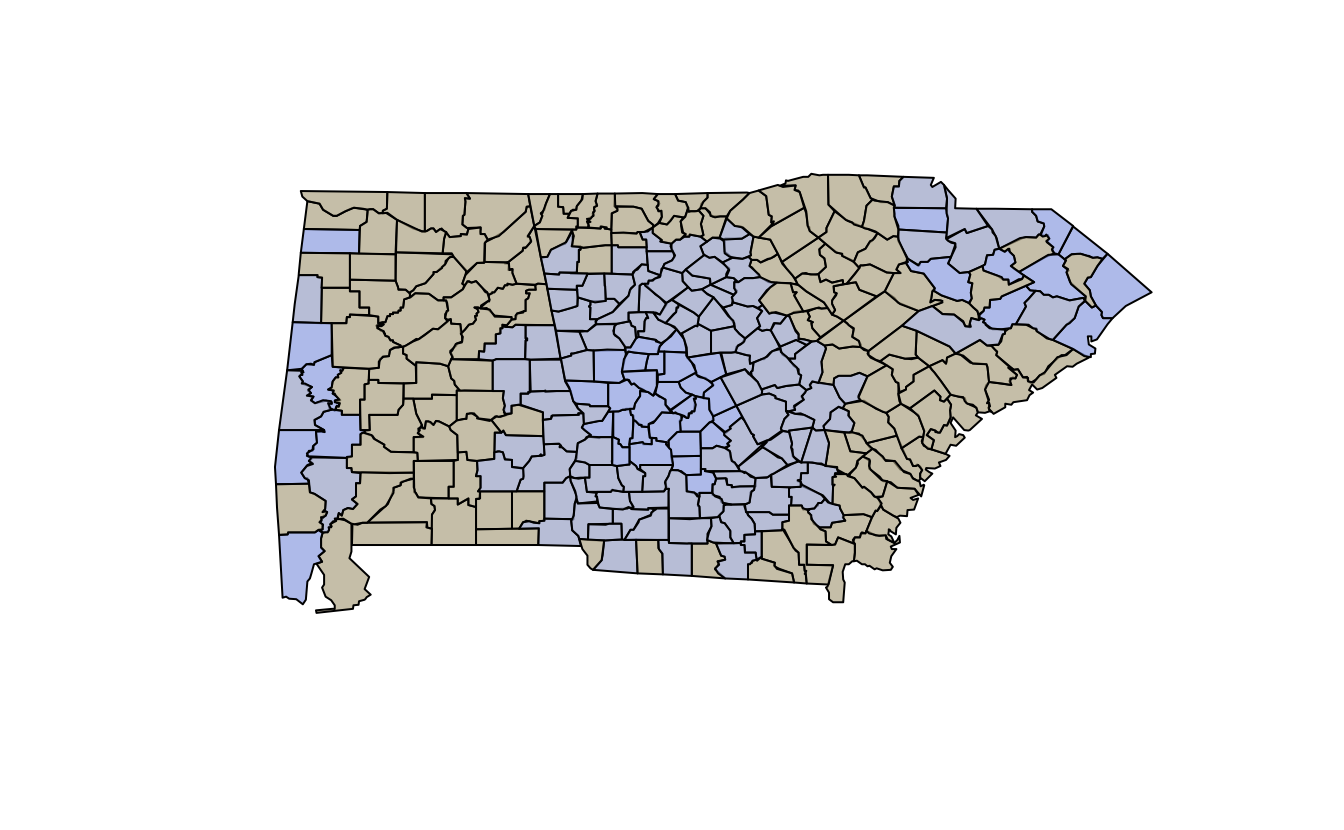
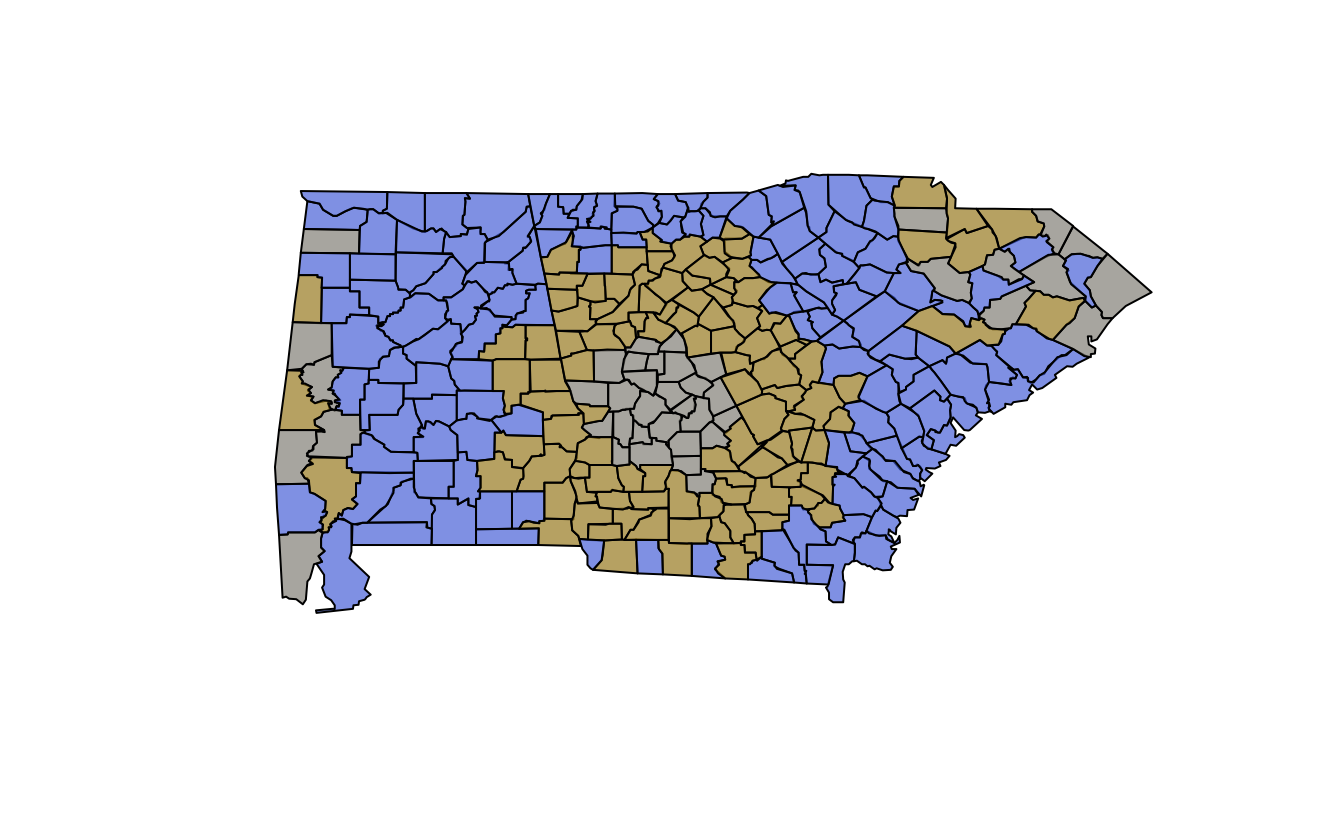
One thing I really love here is the demoplot function, which provides an example of what a plot might look like with a given colour palette. For example:
qualitative_hcl(n = 3,
                alpha = 0.67,
                palette = "Cold") %>%
  demoplot(type = "map")
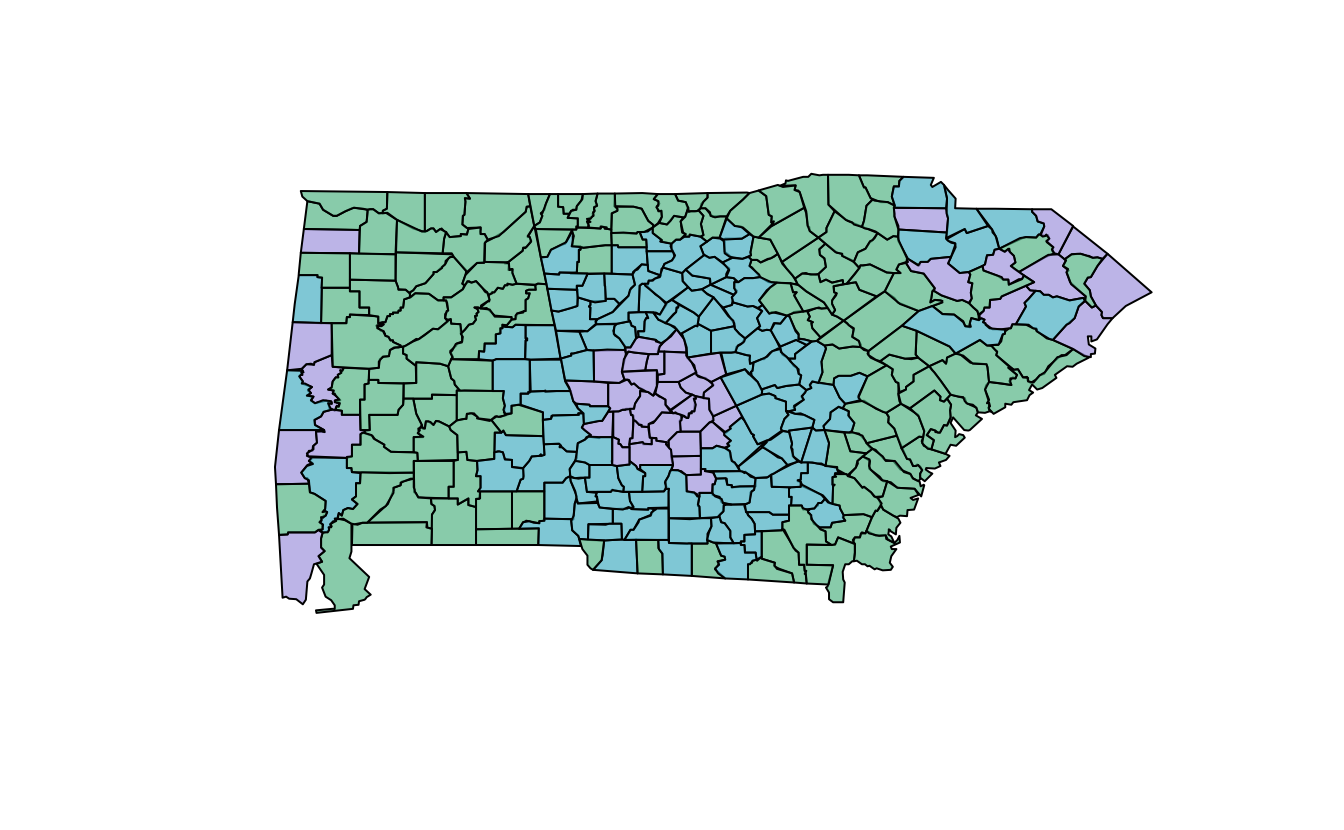
There are many other plot types you can choose from, (“map”, “heatmap”, “scatter”, “spine”, “bar”, “pie”, “perspective”, “mosaic”, and “lines”).
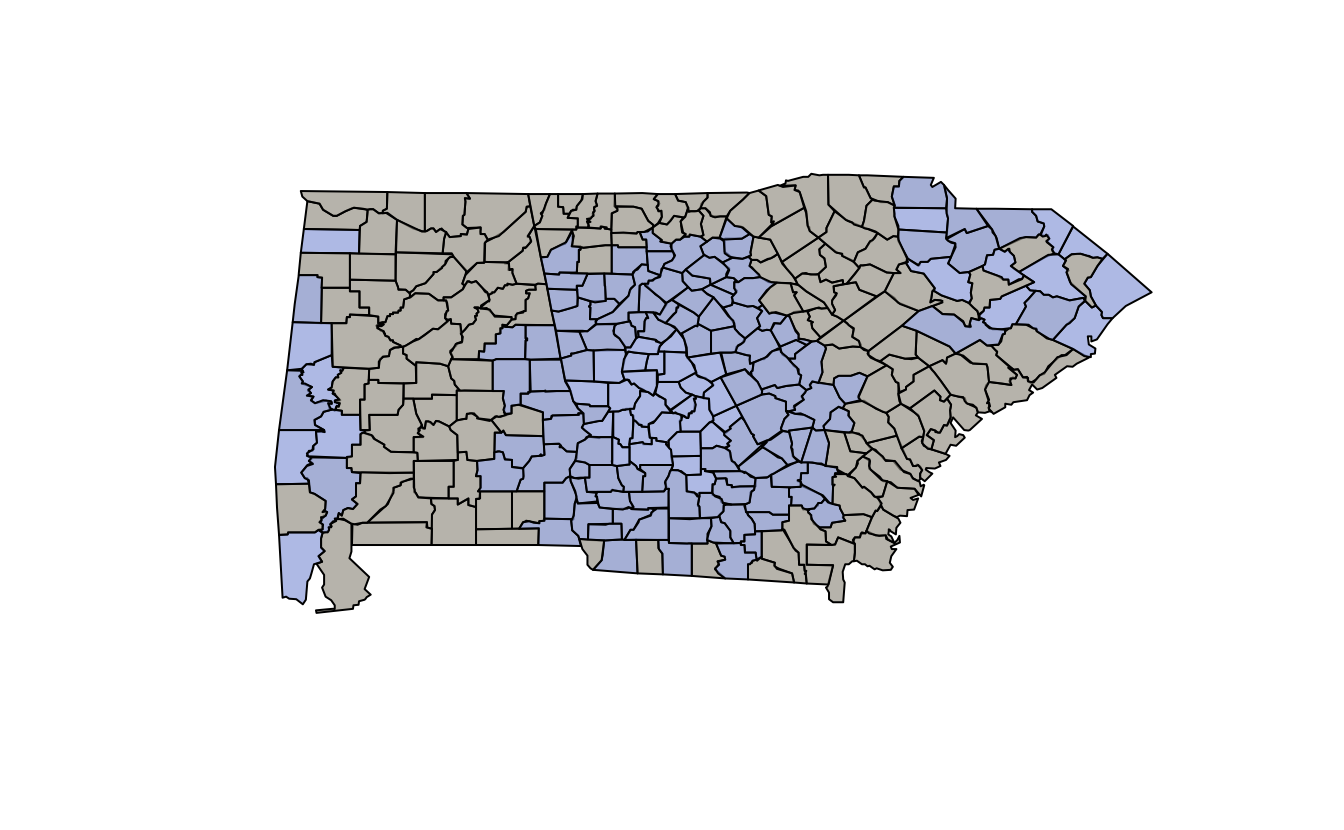
You can combine your returned colour hex codes with the protan(), deutan(), and tritan() functions to simulate a particular type of CVD. For example, convert the colours into protanopia:
qualitative_hcl(n = 3,
                alpha = 0.67,
                palette = "Cold") %>%
  protan()

#> [1] "#98ABE5AB" "#A4AECDAB" "#B7AD90AB"
Let’s wrap this up into a function to return the colour palettes as a list.
qual_return_cvd <- function(palette = "Cold",
                            alpha = 0.67){
  pals <- qualitative_hcl(n = 3,
                          alpha = alpha,
                          palette = palette)
  pals_protan <- protan(pals)
  pals_deutan <- deutan(pals)
  pals_tritan <- tritan(pals)

  return(list(
    protan = pals_protan,
    deutan = pals_deutan,
    tritan = pals_tritan
    ))
}
qual_return_cvd()

#> $protan
#> [1] "#98ABE5AB" "#A4AECDAB" "#B7AD90AB"
#>
#> $deutan
#> [1] "#98A9DFAB" "#8C9BCCAB" "#A39F94AB"
#>
#> $tritan
#> [1] "#A2ACB6AB" "#2CC4BEAB" "#4ABEAFAB"
Why return a list? Then we can use purrr::walk() to iterate over it (purrr::map() also works, but we just want the side effect, the plot, so walk is fine here).
qual_return_cvd() %>% purrr::walk(demoplot)
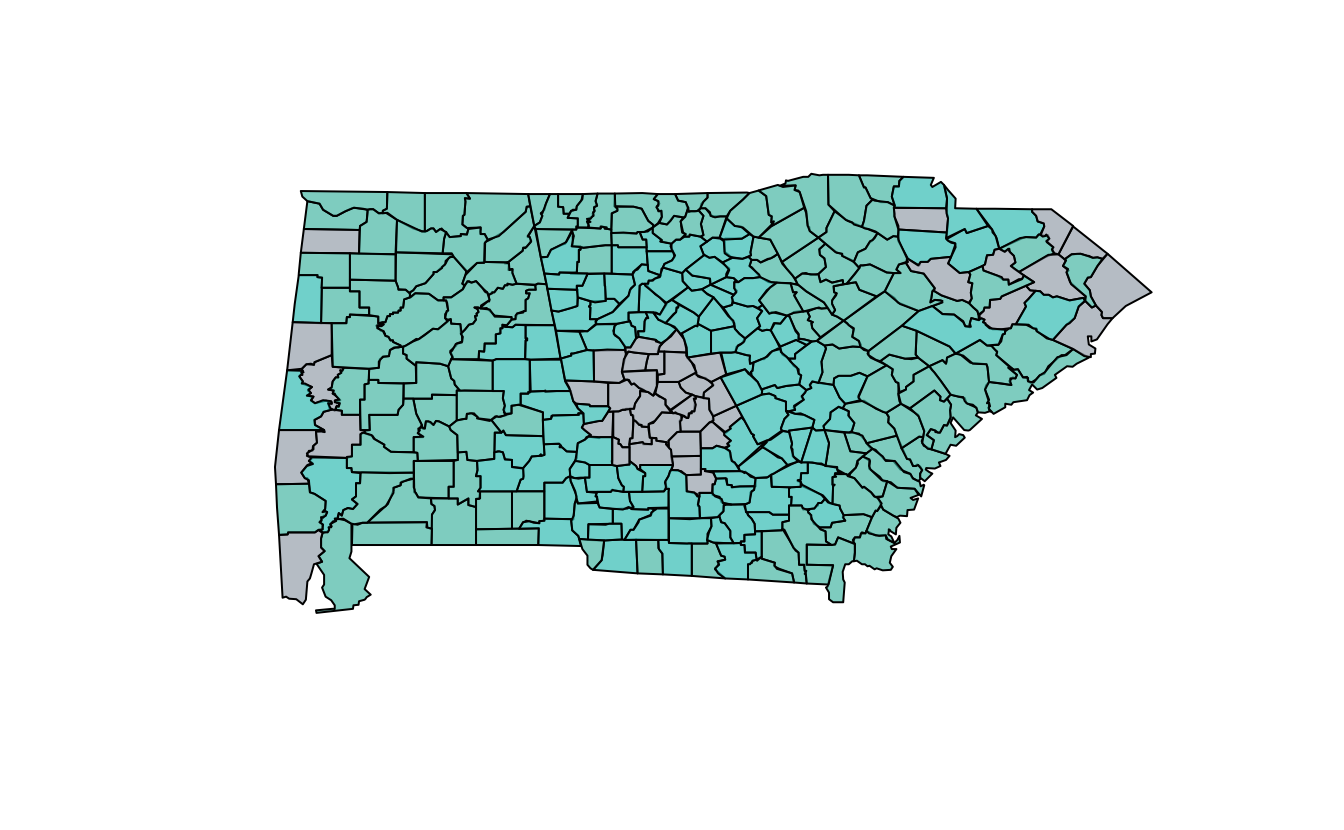
Hmm, Ok, so not the best, let’s try dark 3 again
qual_return_cvd(palette = "Dark 3") %>% purrr::walk(demoplot)
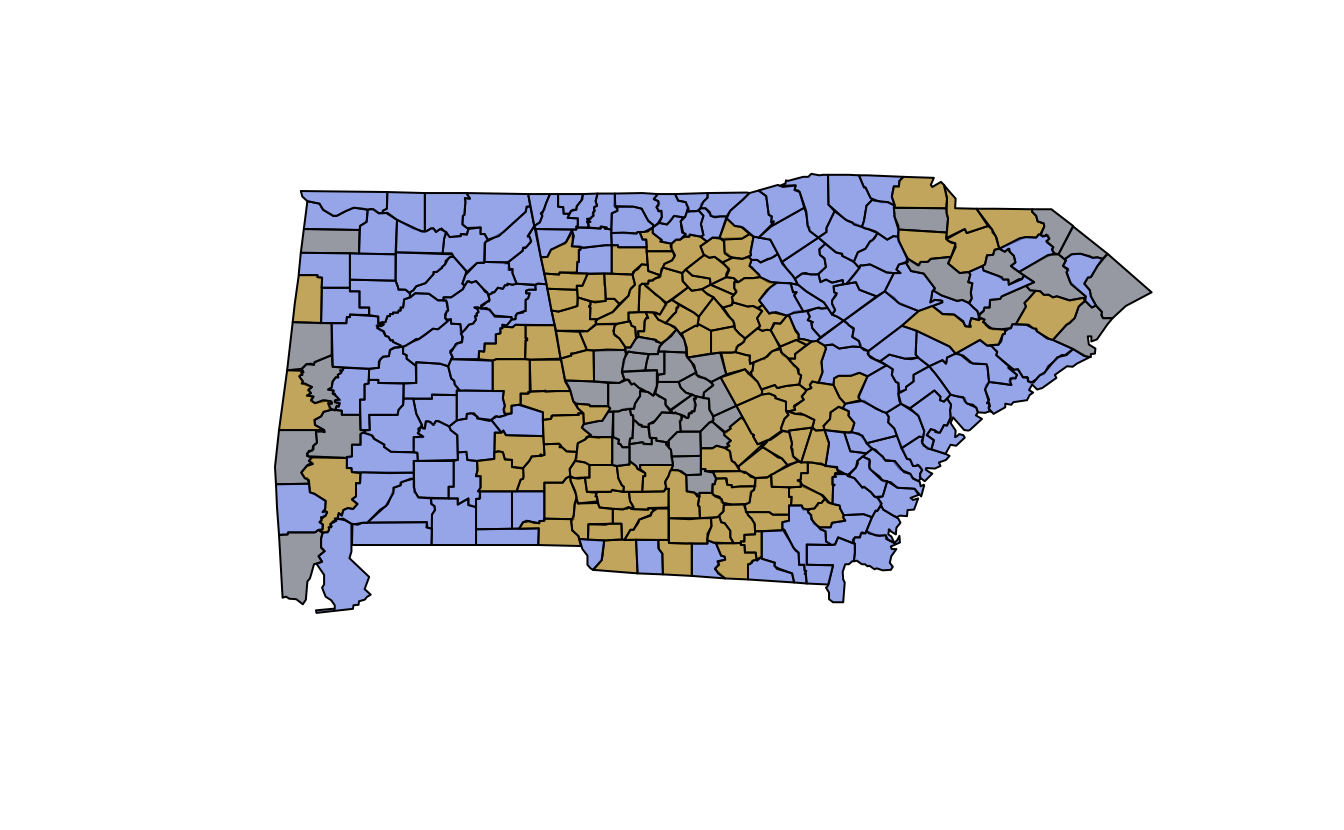
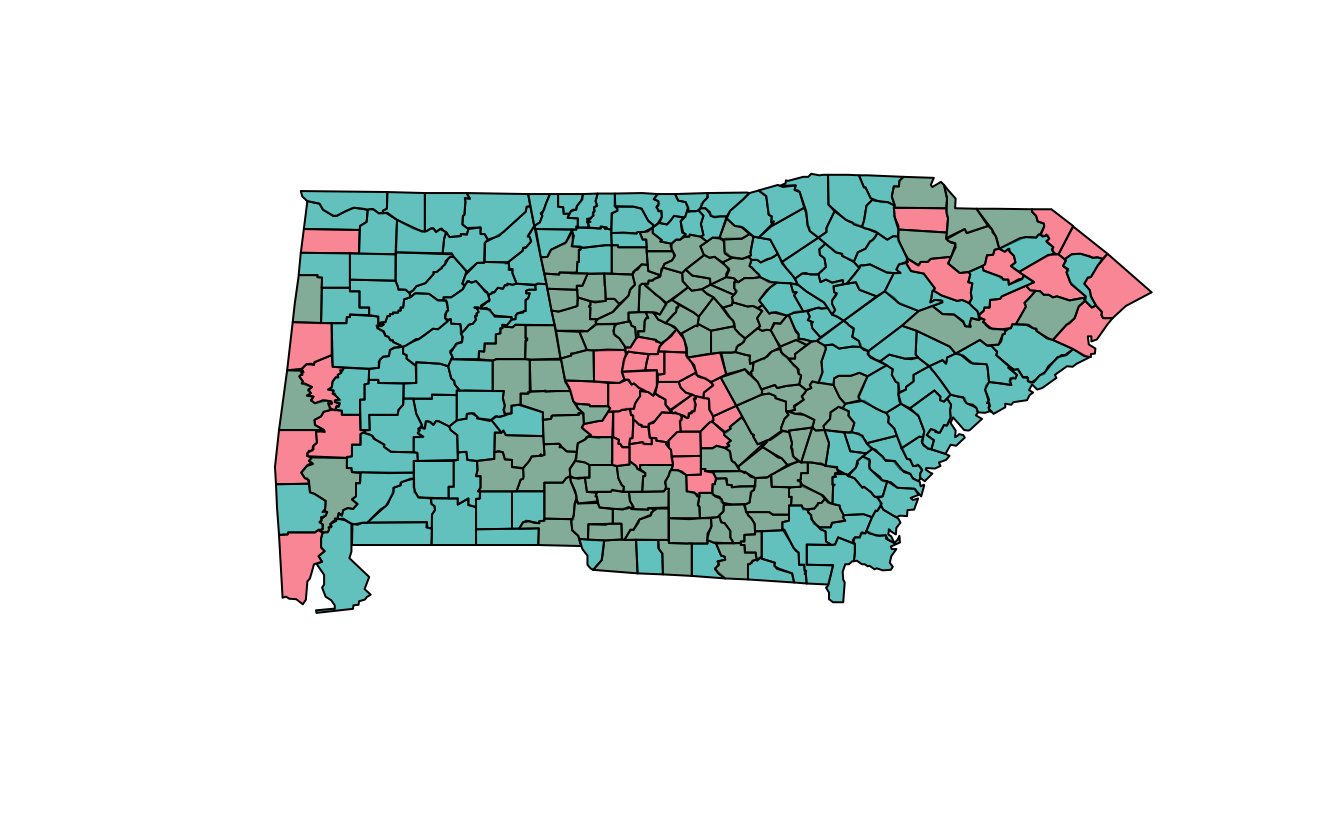
We get much better separation between the colours, so I think I’d go with “Dark 3”.
What is really lovely about the demoplot function is that you can get a quick sense of what your selected palette might look like for a given type of plot, without needing to go to the hassle of putting it through your data. This quick iteration is really key, I think.
End
There is always more to talk about when it comes to colours, and this is just a short post on the topic - I’ve left a lot out of it, otherwise it wouldn’t ever get finished! I do have an upcoming in depth blog post series I’ve been working on that explains the details of what colour blindness is, but it has been a work in progress for about a year. So, I figured I’d rather get this post out quickly and keep it brief.
If you’d like to learn more about colour blindness in graphics, I gave a talk at Monash Data Fluency about this earlier this year, entitled, “The Use of Colour in Graphics” slides and materials are available here, which also has some nice resources provided on where you can learn more.